
EcologyDemonstration article
The thirst of data centres
Power, cooling water, land: the digital has a landscape. An attempt to ask the right questions before quoting numbers.
By Editors (demo) · · 1 min read
Core claim & position
- Core claim
- Resource figures for digital services are hard to compare without their methodology.
- Position
- We deliberately quote no figures – only the questions every published figure should answer.
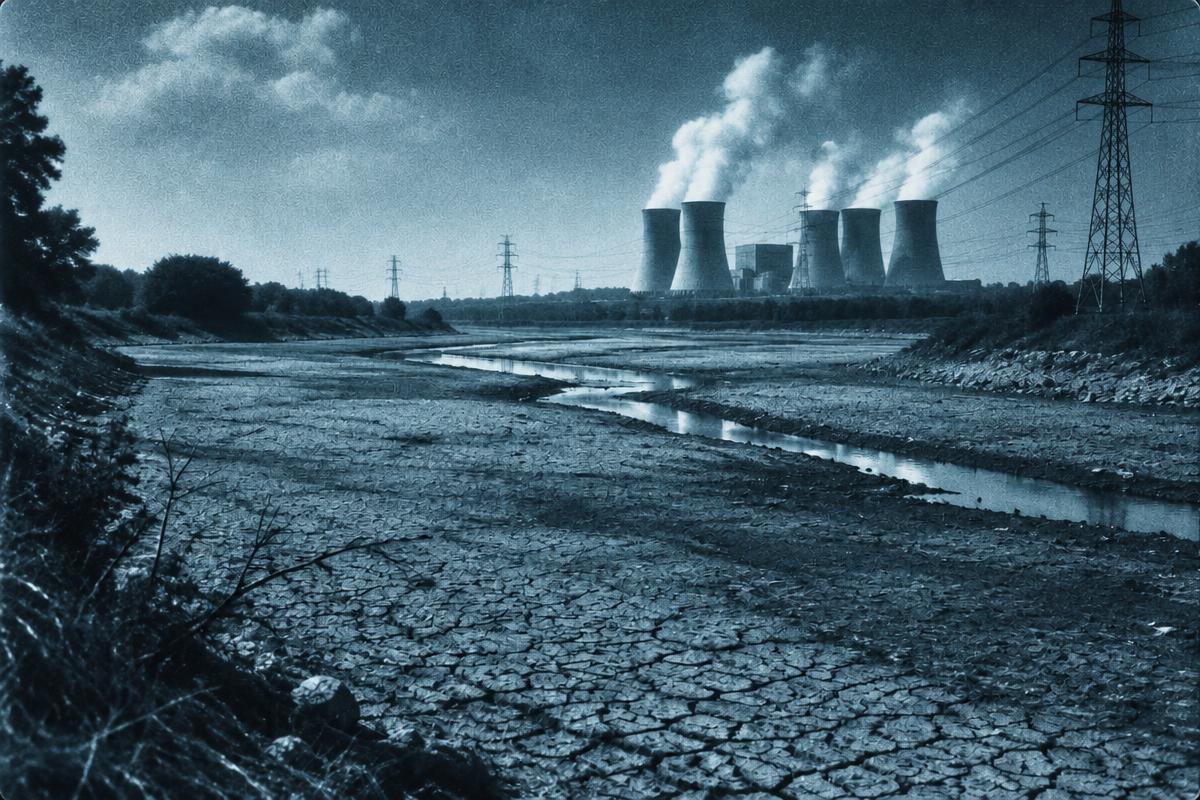
People who speak of “the cloud” rarely think of rivers. Yet computing needs energy, and energy produces heat that has to go somewhere. Depending on site and technology, that happens with air, with water, or both.
01Questions instead of headlines
- Is training, operation or both being measured?
- Does the figure refer to one data centre or an average?
- Which electricity mix is assumed – and at what time of day?
- Is evaporated water distinguished from returned water?
02Place matters
A data centre in a dry region raises different questions from one beside a cool river. The map below is an example of privacy-friendly embedded content: it only loads after you consent.
Map: central Berlin (example)
External content. Loading it sends data to OpenStreetMap.